In the previous article (node.js debug using Chrome DevTools) we have seen how to debug Node.js applications using Chrome DevTools.
Visual Studio Code has built-in debugging support for Node.js runtime without relaying on chrome DevTools .
Create a folder structure as per below image in the host machine 
b. Add following sample code in the index.js file
const express = require("express");
const app = express();
app.get('/', (req, res) => {
res.send("sample express GET end point")
})
app.listen(9300, () => {
console.log("app listening on port 9300");
})
1. By using "Launch" configuration
Select VSCode Run option from left menu and create "launch.json" file with following content
{
"version": "0.2.0",
"configurations": [
{
"type": "node",
"request": "launch",
"name": "Debug Node.Js App",
"skipFiles": [
"<node_internals>/**"
],
"program": "${workspaceFolder}\\index.js",
}
]
}
- VSCode stores debug configuration in a file called "launch.json" which exists in .vscode folder
- "type" attribute used to specify type of debugger i.e. Node, Chrome, CoreCLR, PHP and etc
- "request" attribute used to specify type of action i.e. Launch/Attach
- "name" attribute used to specify name of the configuration which display in the debugger dropdown
- "skipFiles" attribute used to avoid source code that you don't want to debug/step through. The Built-in node.js core modules referred by the <node_internals> name
- "program" attribute used to specify Node.Js app start file to run the application in debug mode
set break-point in the index.js file and run "Debug Node.Js App" configuration from the dropdown

2. By using "Attach by Process ID" configuration
- This is useful to Attach debugger when application already running with --inspect mode
- Add configuration with following content in the launch.json file
{
"version": "0.2.0",
"configurations": [
{
"type": "node",
"request": "attach",
"name": "Debug Node.Js App With Attach",
"skipFiles": [
"<node_internals>/**"
],
"processId": "${command:PickProcess}"
}
]
}
- start node js app using node --inspect index.js
- set break-point in index.js file
- run "Debug Node.Js App With Attach" configuration from the VScode run dropdown
3. By using "Attach to Port" configuration
- This is useful to Attach debugger when application already running with --inspect mode and specific port
- Add configuration with following content in launch.json file
{
"version": "0.2.0",
"configurations": [
{
"type": "node",
"request": "attach",
"name": "Debug Node.Js App with Port",
"skipFiles": [
"<node_internals>/**"
],
"port": 9229
}
]
}
- Start node js app using node --inspect index.js ( i.e. 9229 is the default port for node.js app debugging)
- set break-point in index.js file
- run "Debug Node.Js App With Port" configuration from the VScode run dropdown
4. By using "Nodemon Launch" configuration
- install nodemon globally by using > npm i -g nodemon
- Add configuration with following content in launch.json file
{
"version": "0.2.0",
"configurations": [
{
"type": "node",
"request": "launch",
"name": "Debug Node.Js with Nodemon",
"skipFiles": [
"<node_internals>/**"
],
"program": "${workspaceFolder}\\index.js",
"restart": true,
"runtimeExecutable": "nodemon"
}
]
}
- "restart" : set it true as nodemon does auto-restart on application changes. So, debugger gets attached automatically
- "runtimeExecutable" attribute used to specify different executable i.e. node/nodemon/npm and etc.
- set break-point in index.js file
- run "Debug Node.Js App With Nodemon" configuration from the VScode run dropdown
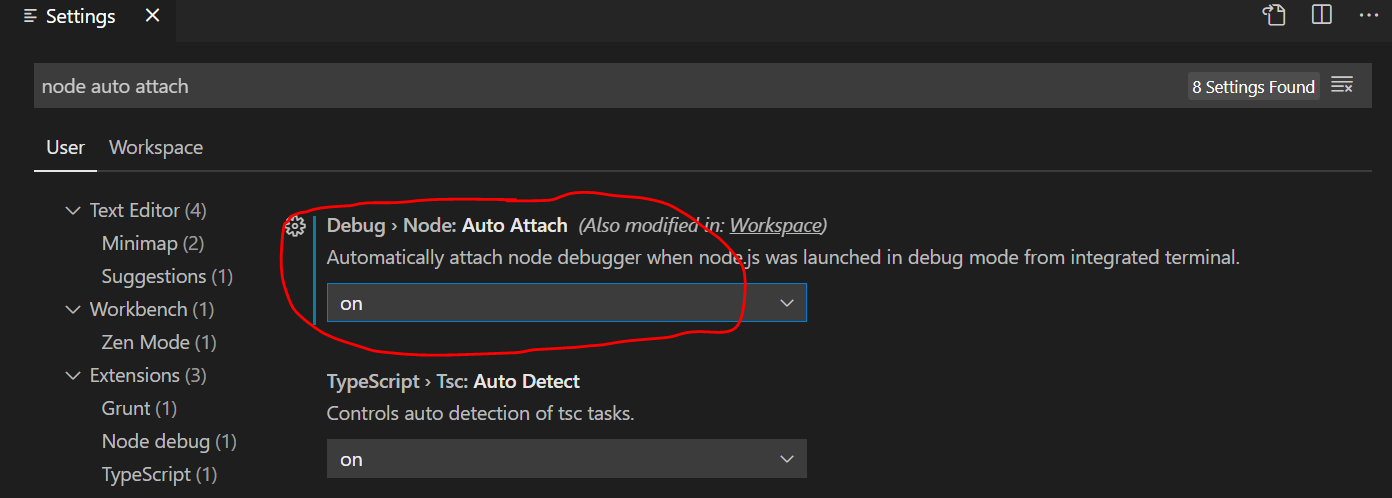
5. By using "Node:Auto Attach" configuration
- VSCode has built-in feature to debug Node js applications without writing any launch.json configuration file
- Go to VSCode settings and set "Node: Auto Attach" on
- Set break-point in the index.js file
- Go to VScode terminal and run node.js application using --inspect mode
- > node --inspect index.js
Happy Coding :)
Comments
Post a Comment