Node.js process listens for a debugging client by enabling --inspect (or) --inspect-brk. By default, it will listen at host and port 127.0.0.1:9229
Create a folder structure as per below image in the host machine
Ex: > node --inspect server.js (or)
> node --inspect-brk server.js (i.e. it stops execution at the start of the script )
- Add "express" npm package as a dependency in package.json file
- configure npm debug command as "node --inspect-brk index.js" in package.json
- Write required code into index.js file to expose GET endpoint using express.js
- execute "npm run debug" command in the terminal
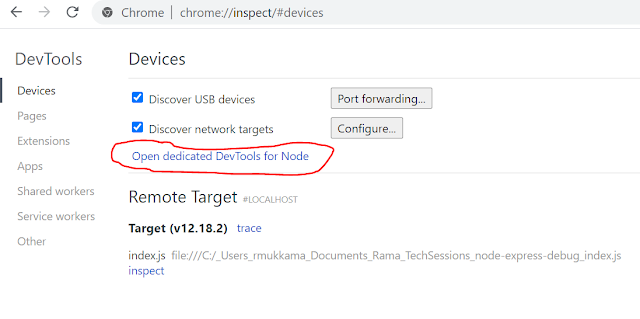
- Open Chrome DevTools by typing "chrome://inspect" in address bar and click on "Open dedicated DevTools for Node"
Step 1:
> npm i express
Step 2:
"scripts": {
"debug": "node --inspect-brk index.js"
}
Step 3:
const express = require("express");
const app = express();
app.get('/', (req, res) => {
res.send("sample express GET end point")
})
app.listen(9300, () => {
console.log("app listening on port 9300");
})
Step 4:
> npm run debug
Step 5:
see the following chrome DevTools window
Chrome DevTools has following major features
- break-point debugging
- JavaScript live Edit
- souremap file searching
- JavaScript profiler with flame-chart
- Heap snapshot inspection, heap allocation time line and profile
Happy Coding :)


Comments
Post a Comment